Digital Design x Aon
I was heavily involved early on in Aon’s digital transformation, working with our product and design teams as well as different stakeholders to elevate our digital brand identity and take our online experience to the next level.
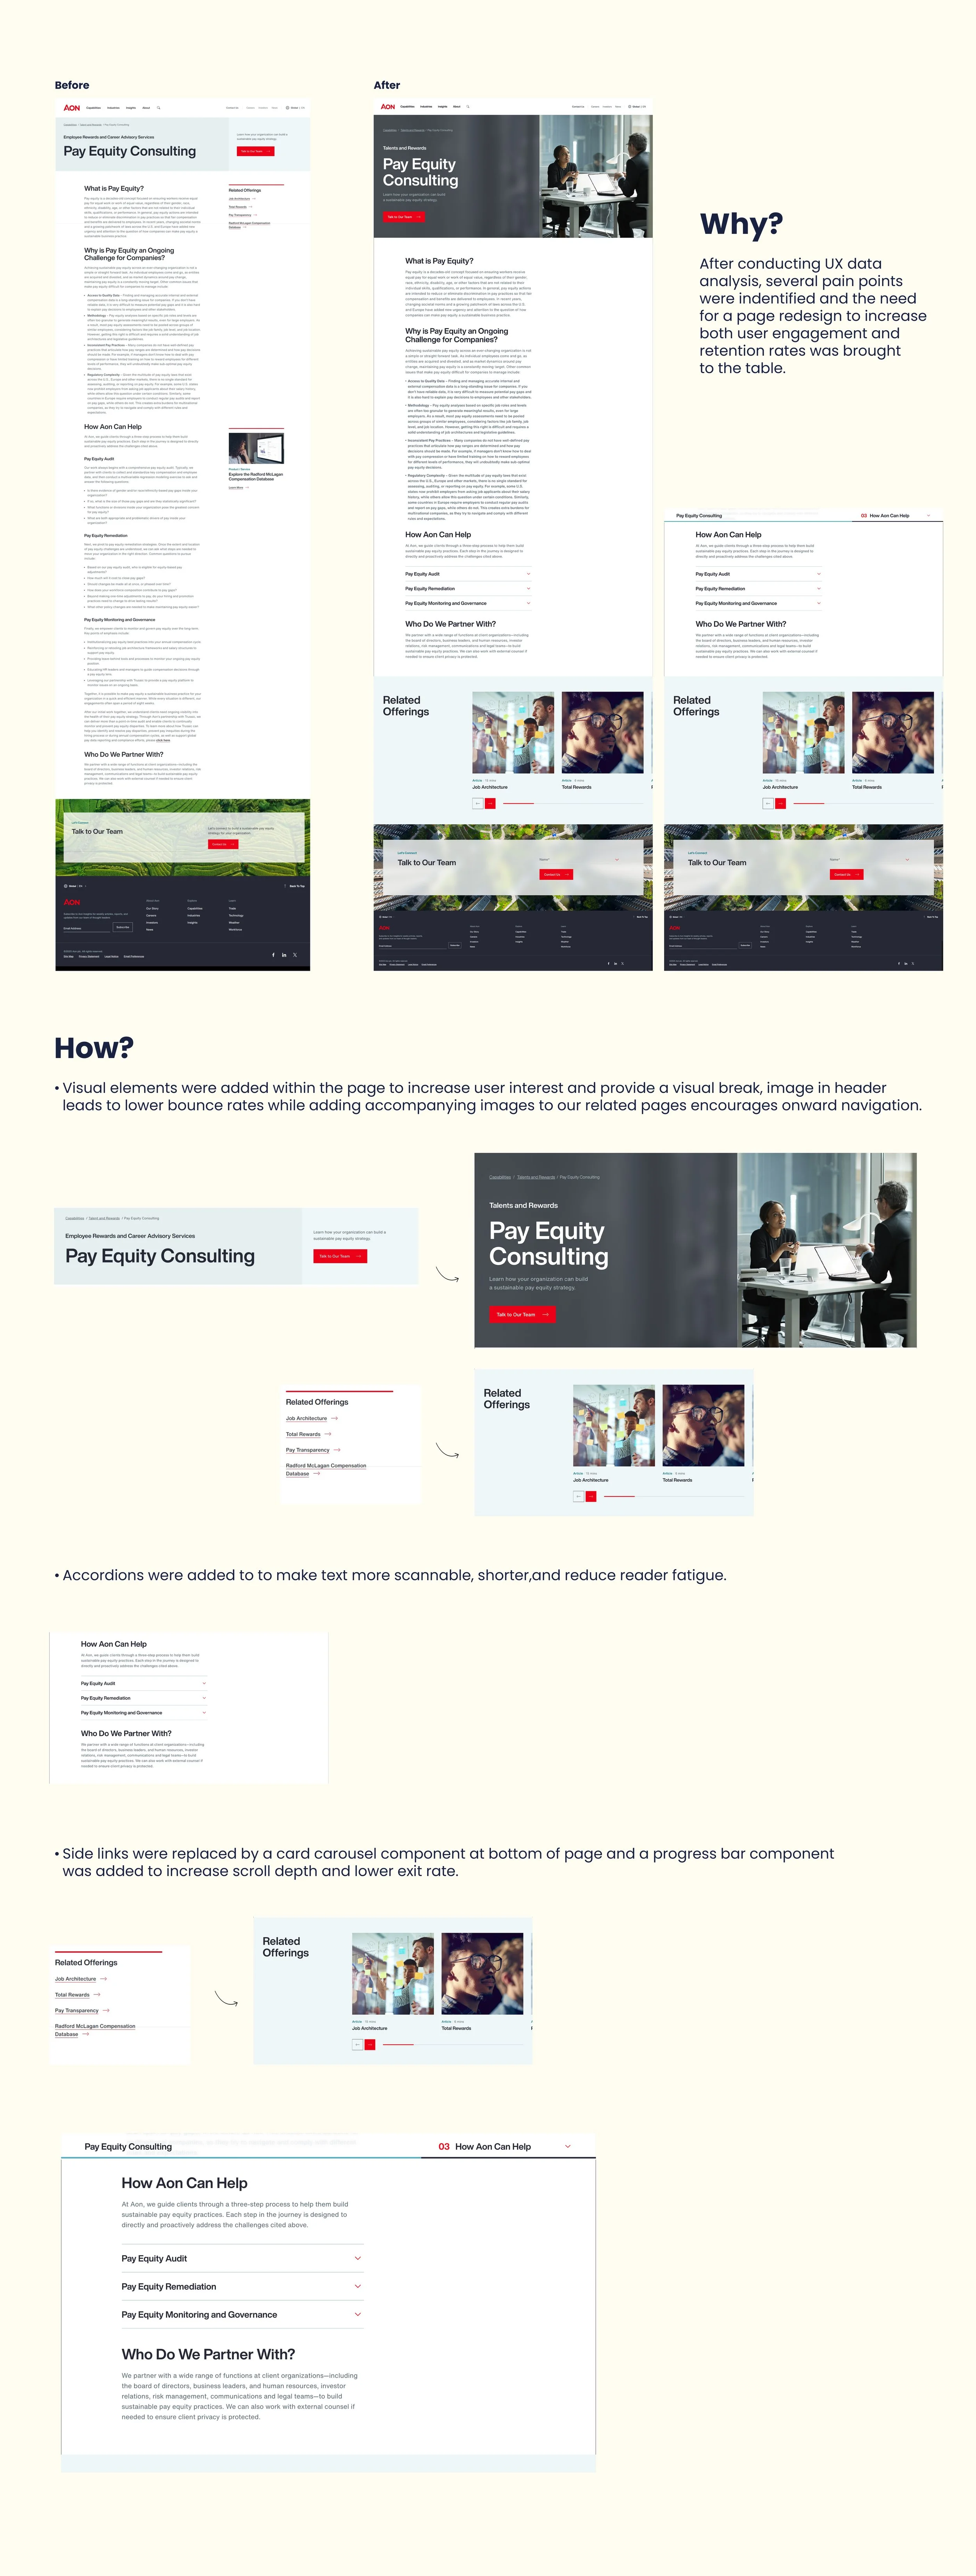
I collected data (e.g page views,bounce rates,exit rates..) that was analyzed hand in hand with heat maps and recordings to determine any pain points and then opportunies were suggested to increase user retention, scroll depth, and general engagement.
Based on my UX reporting; page layout and components were updated to maximize user engagement and retention and data viz component guidelines were established to unify the look and feel of graphs and charts across the platform. This was all updated with the notion of sticking to Aon’s guidelines and visual standards.
Product Page Redesign
Data Viz Examples
At Aon, articles and content for .com come from all backgrounds and expertise, the same goes for infographics and data visualization elements that are recieved from different stakeholders. This makes is crucial to have visual guidelines for charts,graphs, and anything else we recieve to not only maintain consistency across the platform but also stay true to Aon’s look and feel.


